API Gateway — 99.99%
Databases — 100%
CDN — Degraded
Real-Time SaaS Health Monitoring
StatusPulse gives your engineering team and customers a single source of truth for every API, endpoint, and microservice — updated every 30 seconds, visible to the world.
Start Monitoring Free Watch a 2-Min Demo
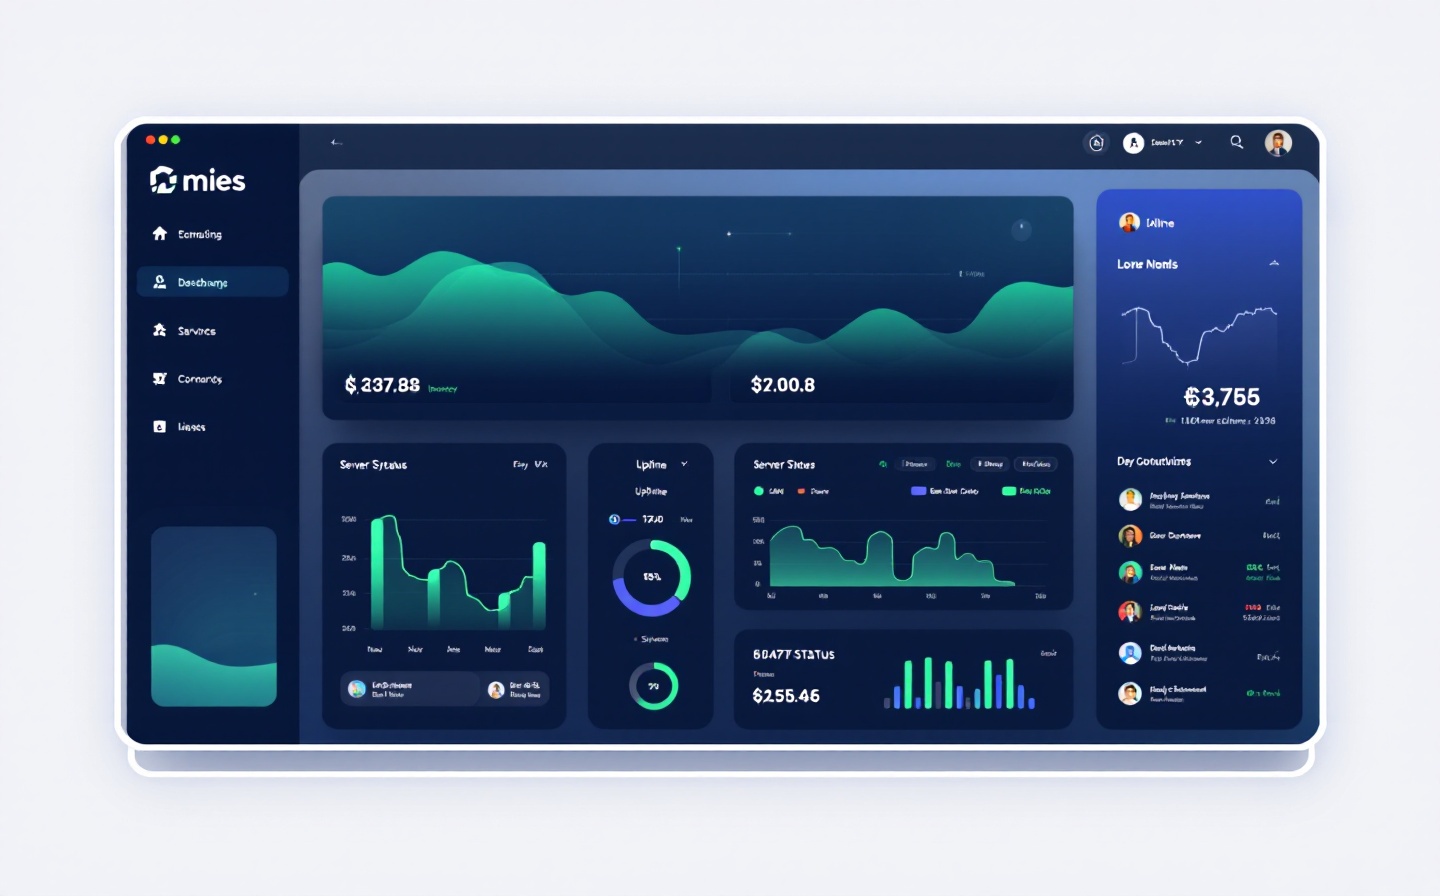
StatusPulse dashboard showing real-time uptime metrics for Stripe, Twilio, and AWS endpoints across a live monitoring grid
Live Status Feed
What’s Happening Right Now
StatusPulse ingests 14,000+ health checks per minute. Here are the latest incidents and resolutions from monitored services worldwide.

Resolved — 3 min ago: Stripe API — HTTP 503 errors on /v1/charges endpoint in us-east-1. Root cause: upstream database failover. Response time returned to 120ms baseline.

Investigating — 12 min ago: Twilio SMS Gateway — Elevated latency (2.4s avg) on messaging endpoints in eu-west-1. Engineering team notified via PagerDuty webhook at 14:32 UTC.

Resolved — 47 min ago: AWS S3 — Partial outage affecting multi-part uploads in ap-southeast-2 (Sydney). Affected 1,204 requests over 22 minutes. Fully recovered.

Major Incident Declared — 1 hr ago: Cloudflare — Degraded performance across 18 edge locations in North America. Cache hit ratio dropped from 96% to 71%. Incident commander assigned.

Operational — All systems green: GitHub API, Slack Webhook, SendGrid SMTP, Vercel Deployments, Datadog Agent — all within normal thresholds for the past 6 hours.

Platform Capabilities
Everything You Need to Monitor at Scale
From single endpoints to distributed microservice architectures, StatusPulse adapts to your stack.
Continuous Monitoring
Check HTTP endpoints, TCP ports, SSL certificates, and DNS records from 24 global probe locations every 30 seconds. See geographic latency maps and response-time trends in real time.
Smart Alerting
Route incidents to Slack, PagerDuty, Opsgenie, or email with intelligent deduplication. Escalation policies ensure the right engineer is paged — no more alert fatigue or missed outages.
Public Status Pages
White-label status pages your customers can trust. Custom domains, RSS feeds, and webhook integrations keep stakeholders informed automatically — no manual updates needed.
Historical Uptime Reports
Generate SLA-compliance reports for any time window. Export to PDF or CSV for board meetings and client reviews. 99.97% uptime for your Stripe integration last quarter? Prove it.
Team Collaboration
Role-based access for SREs, support leads, and executives. Assign incident ownership, add timeline annotations, and bridge the gap between engineering and customer-facing teams.
API-First Design
Full REST API with SDKs for Python, Go, and Node.js. Automate monitor creation, pull incident data into your own dashboards, and integrate StatusPulse into your CI/CD pipeline.
Trusted by Engineering Teams
Numbers That Matter
2.4M Health Checks
Executed daily across 180,000 monitored endpoints for 6,200+ companies — from startups to Fortune 500.
99.99% Platform Uptime
StatusPulse itself is monitored by three independent third-party services. Our own status page has not shown a major incident in 847 days.
< 4.2s Mean Time to Alert
From the moment a service degrades to the moment your on-call engineer receives a PagerDuty notification. Measured across 14,000 incidents in the last 12 months.
24 Global Probes
Monitoring nodes in North America, Europe, Asia-Pacific, and South America — so you see outages from your customers’ perspective, not just your data center.
Customer Voice
“Before StatusPulse, our support team spent 12 hours a week fielding ‘is the system down?’ tickets. After we launched our public status page, those tickets dropped to zero in the first month. The alerting integrations alone saved us from three production incidents last quarter.”
— Priya Menon, VP of Engineering at Cartograph (B2B logistics platform, 340 employees)
Frequently Asked Questions
Quick Answers

How many monitors are included in the free plan? — 10 active monitors with 1-minute check intervals and one public status page. No credit card required to start.

Can I use my own domain for the status page? — Yes. Bring your own domain on Pro and Enterprise plans. We provide CNAME instructions and automatic SSL provisioning via Let’s Encrypt.

What happens if StatusPulse itself goes down? — We run redundant monitoring clusters in three AWS regions. Even if one region fails, health checks continue from the remaining two. You can also configure backup alerting through a secondary integration.

Do you support synthetic monitoring with custom scripts? — Enterprise customers can upload JavaScript-based synthetic checks that run through our browser automation engine — perfect for testing checkout flows, login sequences, and API authentication chains.

Stop Guessing. Start Knowing.
Your customers deserve transparency. Your engineering team deserves reliable alerts. StatusPulse gives you both — from day one.
Create Your Free Account Talk to Sales